Is it possible to get the Display Buffer into a Floating Tile?
-
Apologies for making more than one post today : )
Does anyone know if it's possible to get a Display Buffer from scriptnode, into a floating tile?
I am trying to get this peak meter to display on the UI.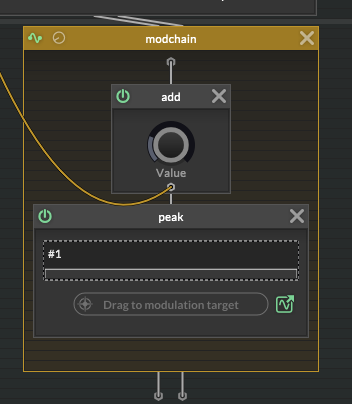
I do have access to the buffer if I need to work out a way graph this manually... But I would rather not

Although I admit that approach would give me fantastic control.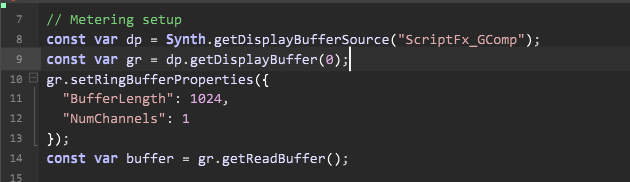
-
 G griffinboy marked this topic as a question on
-
@griffinboy no currently there is no floating tile for this task but this method
https://docs.hise.dev/scripting/scripting-api/displaybuffer/index.html#createpath
will do the heavy lifting and create a path that you can render in a ScriptPanel using either the scripting API or if your in experimental mode, with the new CSS renderer…
-
G griffinboy has marked this topic as solved on
-
@Christoph-Hart
Thanks I am looking into it!
I am having an issue understanding the documentation though, what am I doing wrong?
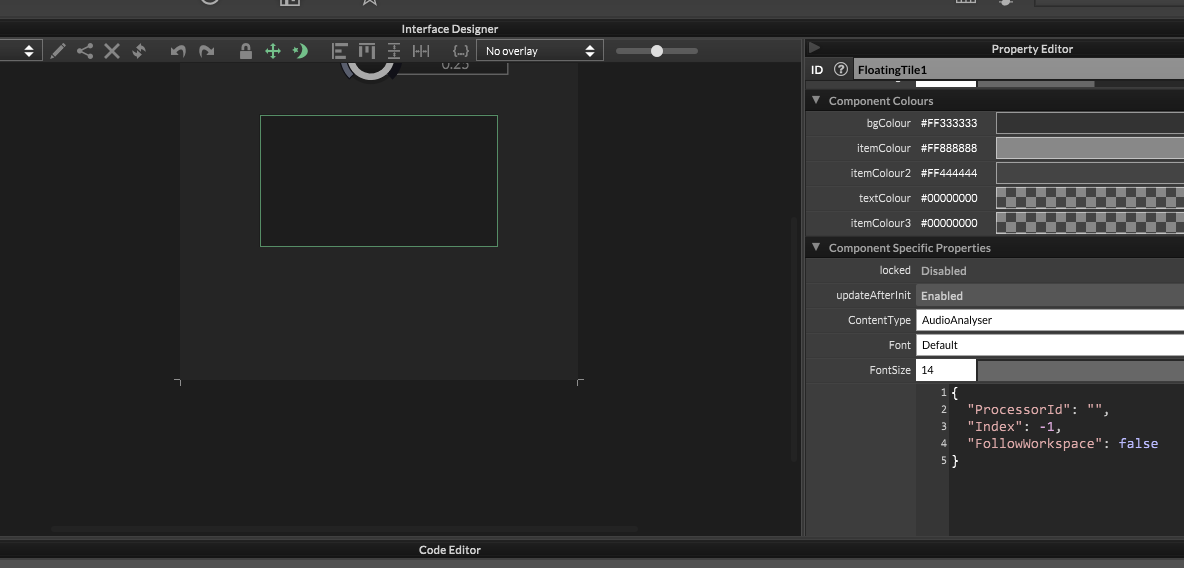
I haven't managed to draw a path using the buffer yet. I've set up this paint routine to draw the path inside a tile but I am not getting anything .
The buffer is definitely working because I am also setting a slider to the peak value, which is working.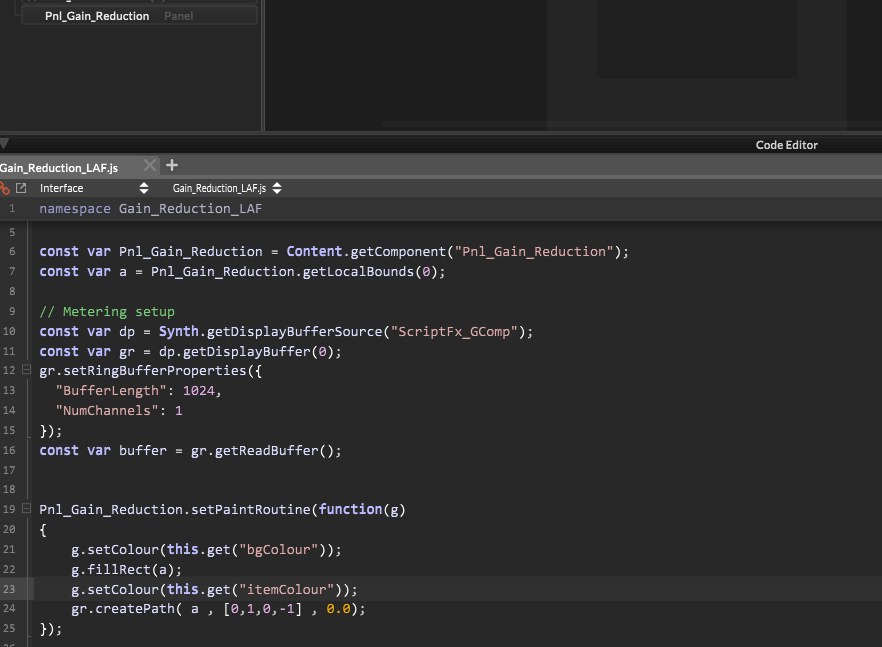
EDIT:
I solved it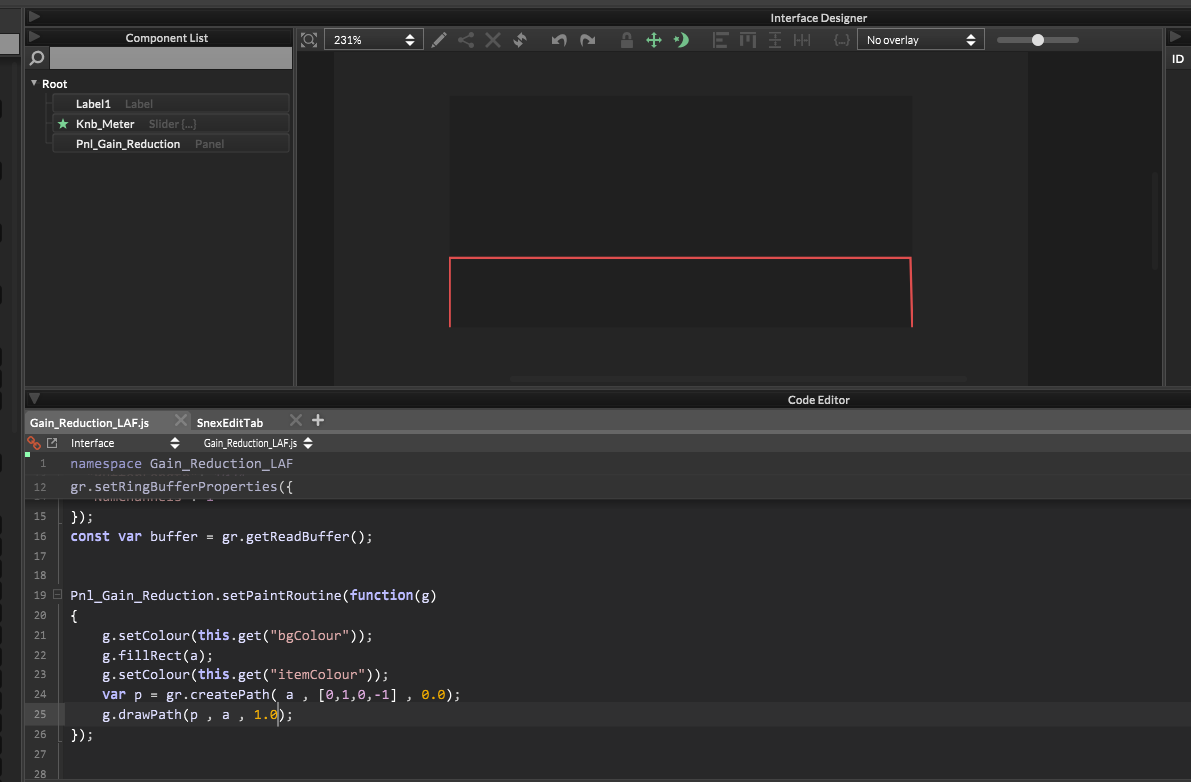
-
G griffinboy has marked this topic as unsolved on
-
G griffinboy has marked this topic as solved on
-
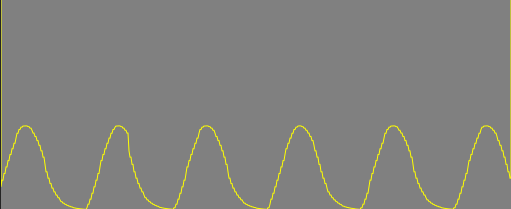
@Christoph-Hart How is the inverted plotter supposed to work? I was assuming that a plotter would set the value at the bottom of the panel to 0 and draw upwards, and an inverted plotter would set the value at the top of the panel to 0 and draw downwards.
I'm not seeing any difference when I change the START and use drawPath.
g.createPath(area, [0,1,0,-1], 0.0);
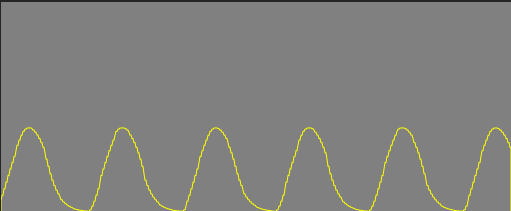
g.createPath(area, [0,1,0,-1], 1.0);
I AM seeing a difference if fillPath:
g.createPath(area, [0,1,0,-1], 0.0);
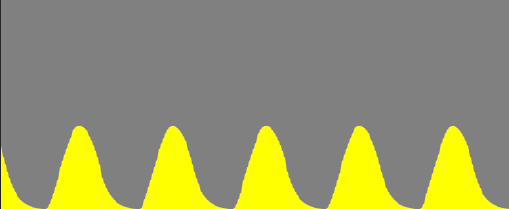
g.createPath(area, [0,1,0,-1], 1.0);
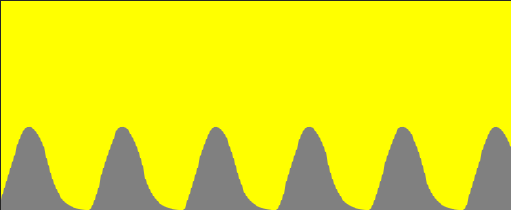
The question: Is this the way it's supposed to work? If so, how can I invert the value of a display buffer so I can start drawing at the top of the panel?
// Oscilloscope:
d.createPath([0, 0, w, h],   // target rectangle
             [-1, 1, 0, -1], // samplerange 0 - numSamples,
                             // valuerange: from -1 to 1
             0.0);           // start at the center (bipolar)

// Plotter
d.createPath([0, 0, w, h],   // target rectangle
             [0, 1, 0, -1],  // samplerange 0 - numSamples,
                             // valuerange: from 0 to 1
             0.0);           // start at the bottom (unibipolar)

// Inverted Plotter
d.createPath([0, 0, w, h],   // target rectangle
             [0, 1, 0, -1],  // samplerange 0 - numSamples,
                             // valuerange: from 0 to 1
             1.0);           // start at the top (negative)
Dan Korneff - Producer / Mixer / Audio Nerd
-
@Dan-Korneff Seems to work if you just flip the height to be a negative value:
var p = gr.createPath([a[0], a[1], a[2], -a[3]], [0,1,0,-1], 0.0); -
@ustk You're hired!
-
@Christoph-Hart I need to increase the buffer size to about twice what's available to the Plotter. Can I just change this:
return SimpleRingBuffer::withinRange<4096, 32768 * 4>(v) && wasPowerOfTwo;to:
return SimpleRingBuffer::withinRange<4096, 32768 * 8>(v) && wasPowerOfTwo;Or will this blow up??
Dan Korneff - Producer / Mixer / Audio Nerd
-
So far, no explosions
Dan Korneff - Producer / Mixer / Audio Nerd
-
@Dan-Korneff I imagine the only issue would be that a longer buffer would require more time to create a path, but if it can be noticeable I don't know

-
@Dan-Korneff @ustk It seems interesting. Can you guys share a basic fast snippet for this please?
-
Bump please
-
@JulesV Here is a custom node example. After adding a display buffer to the custom node and compiling it, you need to open this node in
HardcodedMasterFXand apply the following method. To get the look I wanted here, I had to keep the buffer length quite high, it's set to 65536 :)The drawing process takes place in a timer object.
const var dp = Synth.getDisplayBufferSource("HardcodedMasterFX"); const var gr = dp.getDisplayBuffer(0); gr.setRingBufferProperties({ "BufferLength": 65536, "NumChannels": 1 }); const var Panel1 = Content.getComponent ("Panel1"); const var a = Panel1.getLocalBounds(0); const var Cmpt = Engine.createTimerObject(); Cmpt.setTimerCallback(function() { Panel1.setPaintRoutine(function(g) { g.setColour (this.get("bgColour")); g.fillRect(a); g.setColour(this.get("itemColour")); var p = gr.createPath(a, [0,1,0,-1], 1.0); g.fillPath(p, a); }); }); Cmpt.startTimer(40); -
@orange is there some reason you are declaring the paint routine in the timer and not outside it, then issuing a repaint in the timer?
HISE Development for hire.
www.channelrobot.com -
@Lindon Not a specific reason, I just used the time object to refresh the paint.
If you have a better usage recommendation instead, I'm open to it. -
@orange well clearly I havent tried it, but give this a go and see if it works?
const var dp = Synth.getDisplayBufferSource("HardcodedMasterFX");
const var gr = dp.getDisplayBuffer(0);

gr.setRingBufferProperties({
"BufferLength": 65536,
"NumChannels": 1
});

reg p;
const var Panel1 = Content.getComponent ("Panel1");
Panel1.setPaintRoutine(function(g)
{
	g.setColour (this.get("bgColour"));
	g.fillRect(a);
	g.setColour(this.get("itemColour"));
	p = gr.createPath(a, [0,1,0,-1], 1.0);
	g.fillPath(p, a);
});


const var a = Panel1.getLocalBounds(0);
const var Cmpt = Engine.createTimerObject();
Cmpt.setTimerCallback(function()
{
	Panel1.repaint()
});

Cmpt.startTimer(40);
HISE Development for hire.
www.channelrobot.com -
@Lindon That’s better, thanks :)
-
This post is deleted! -
@orange glad that it worked...
HISE Development for hire.
www.channelrobot.com -