@mjc123 Exactly what i'm after, thank you!
M
Posts
-
RE: Is there a way to control the level of step modulator steps with knob/button?posted in Scripting
-
RE: Is there a way to control the level of step modulator steps with knob/button?posted in Scripting
@d-healey Thanks for your help!! I want to control each step with a respective button (which toggles between 0% and 100% value on the step.
Is this possible? If so - if you could point me in the right direction that would be very helpful!
-
RE: Link animation speed to rate?posted in Scripting
@dannytaurus Thank you for the guidance! I'll give it a go :)
-
Link animation speed to rate?posted in Scripting
Say i have an animation that is looping constantly, linked to a time-based modulator such as an LFO.
Can I link them together so that the animation speed/loop speed (no. of frames per second) increases in line with the LFO's speed/rate?
And should I use being using lottie for this purpose or stick to usual HISE animations?
Bit new to this still, thanks for your help!
-
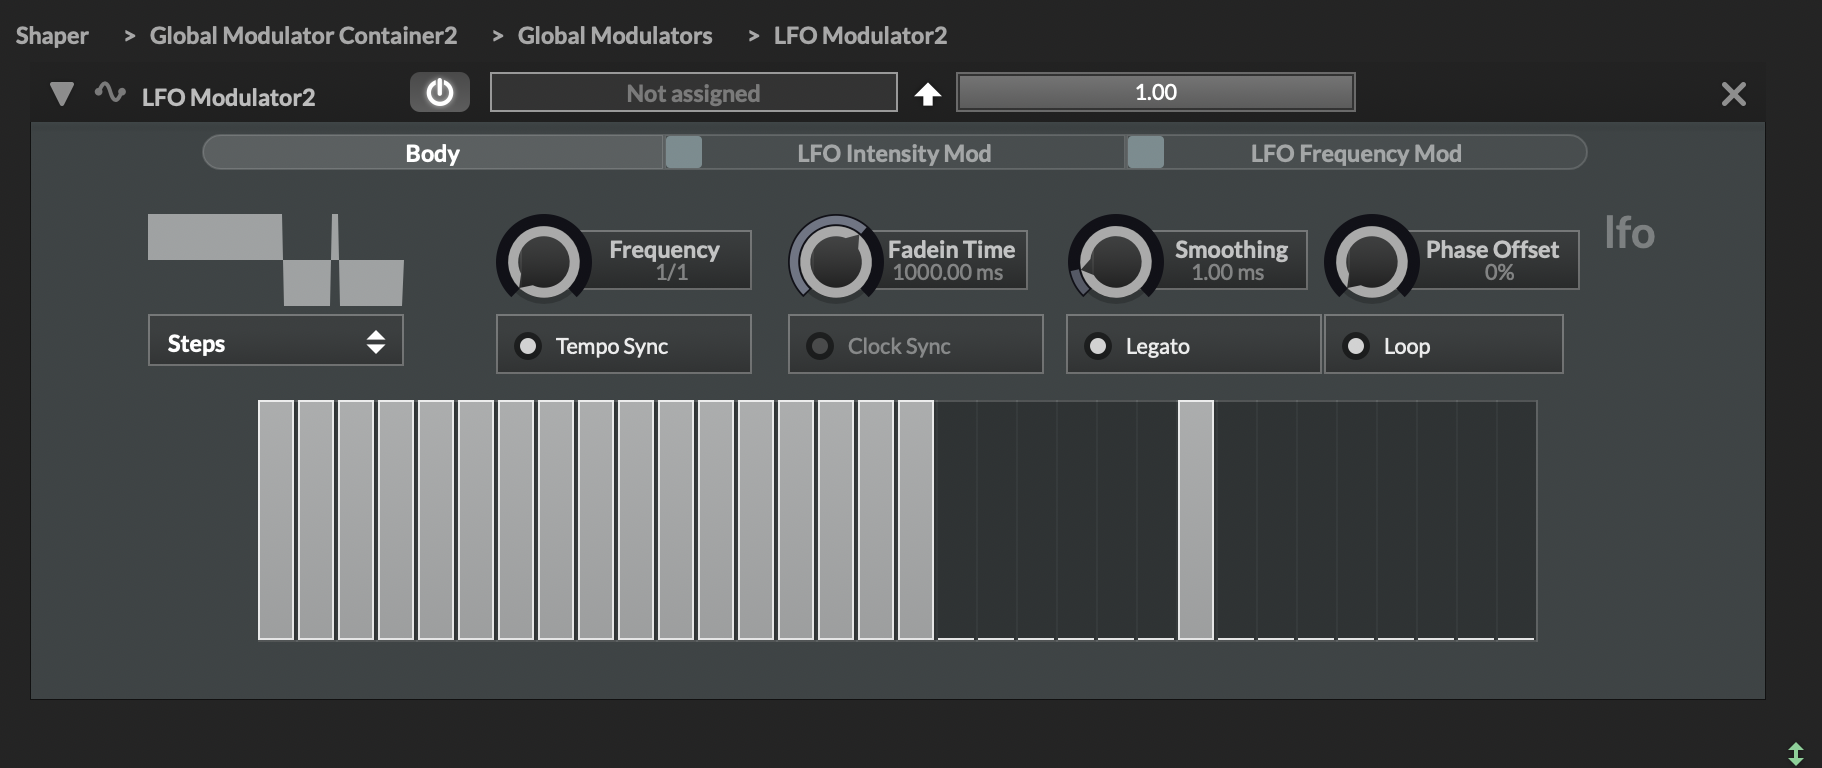
Smoother version of table 'line' animationposted in Scripting
Hi, I am trying to create an animation for my LFO effect plugin. I am using the table to control a shape, which can be applied to various modulators like volume, low pass filter etc.
However I need to figure out a way to create a smoother version of the 'moving line' indicating the current X-axis value on the table. See video below to see what I mean. It just appears slightly block-y at the moment and I want to create a new version that is smoother.
What's my best bet, should I be using Lottie animations/strips for this? Can I link it up with the rate if so?
Hopefully that makes sense!
-
Is there a way to control the level of step modulator steps with knob/button?posted in Scripting
Hey, random question...
Is it possible to control specific steps on the step modulator with UI controls?
I want to give each step (32 in total) a button each which allows the user to switch the step level from 0.00 to 1.00 for each step.
Is this at all possible?
Thanks :)
-
Knob that controls step modulator in increments of 1, 2 ,4 ,8 ,16, 32?posted in Scripting
Any suggestions on best method for creating a knob that controls 'NumSteps' on the step modulator, that works in a non-linear fashion? So rather than 1,2,3,4,5,6 etc, the options are 1, 2, 4, 8, 16, 32
Thank you
-
Can't drag knobs in presentation mode?posted in Scripting
Hey, sorry if this is an obvious solution (hopefully it is)
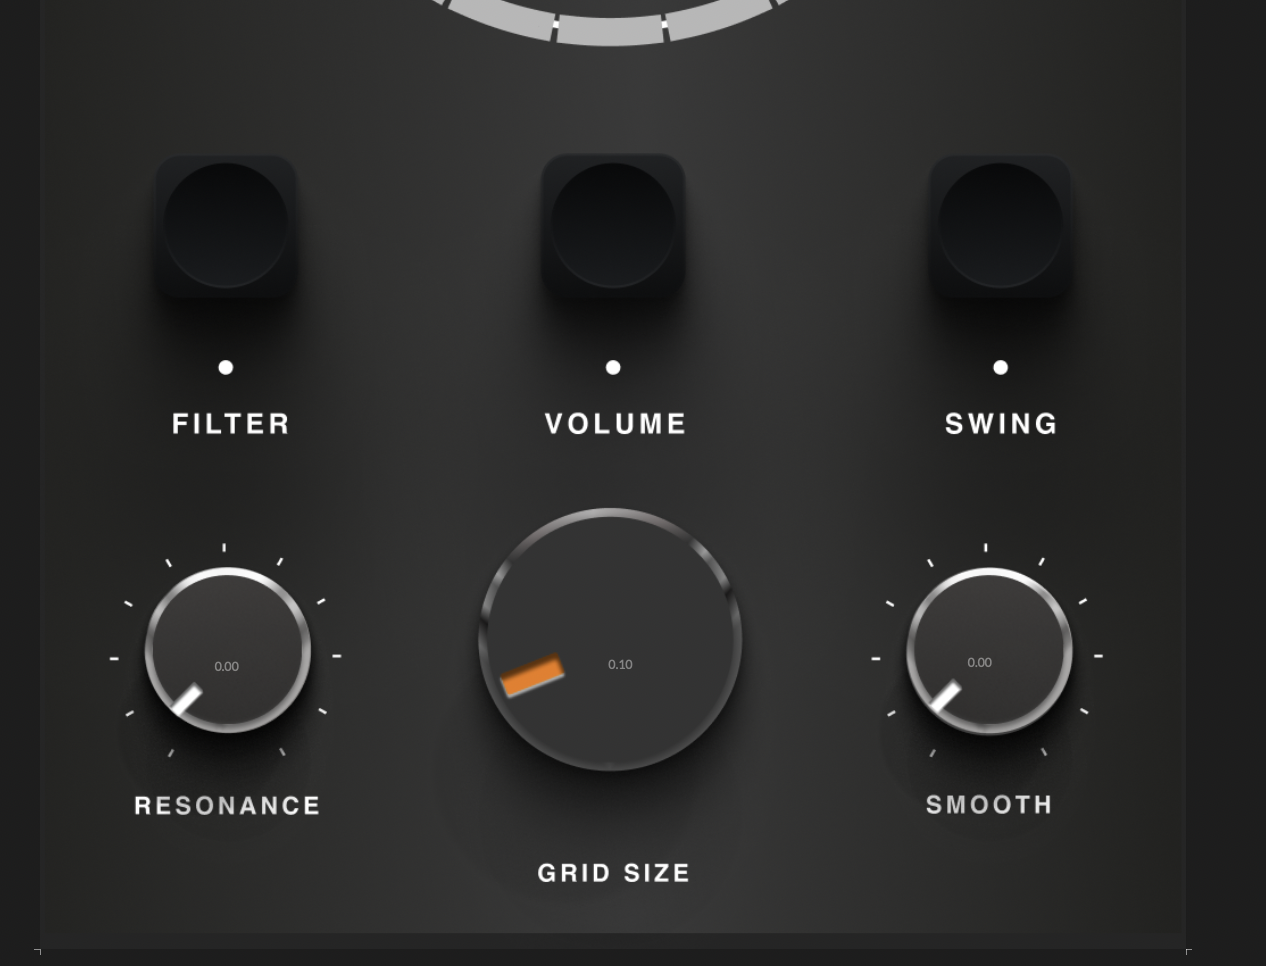
In presentation mode I can't seem to drag any knobs on my UI. It originally worked but now seems to have fallen back into a mode where you have to type in the % value to adjust the knob (value is shown in small lettering, as seen in the attached screenshot)
How do I change this back so I can physically drag the knob while in presentation mode?
Thank you!
-
RE: Table LAF.posted in General Questions
@d-healey Hi there, I am replying to this post three years later. Is there any workaround for this at all? (Making the .tablePoint in a table larger than the boundary restrictions for g.drawEllipse(obj.tablePoint, 1.0);
Thank you!
-
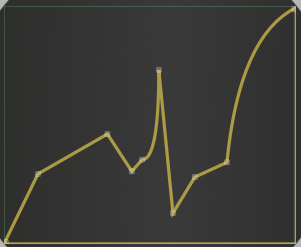
Hide table perimeter lines?posted in Scripting
Hi there, sorry if this is an obvious one, I am very new to HISE!
Is there any way to affect the X and Y axis lines on a table component, while not affecting the curves/lines IN the graph itself?
I can change the thickness of ALL drawn lines of the table with:
laf.registerFunction("drawTablePath", function(g, obj)
{
	g.setColour(obj.bgColour);
    g.drawPath(obj.path, obj.area, 5.0);
    g.setColour(Colours.withAlpha(obj.bgColour, 0.00));

});
However this increases the thickness of the curves inside the graph, AND the X and Y axis lines. I want to separately style the lines/curves INSIDE the graph, and the border/XY Axis
Thank you - sorry this is probably obvious
(Example below, I want to remove the yellow lines on the X and Y axis)