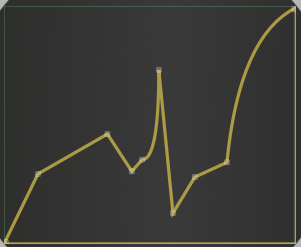
Hide table perimeter lines?
-
Hi there, sorry if this is an obvious one, I am very new to HISE!
Is there any way to affect the X and Y axis lines on a table component, while not affecting the curves/lines IN the graph itself?
I can change the thickness of ALL drawn lines of the table with:
laf.registerFunction("drawTablePath", function(g, obj)
{
	g.setColour(obj.bgColour);
    g.drawPath(obj.path, obj.area, 5.0);
    g.setColour(Colours.withAlpha(obj.bgColour, 0.00));

});
However this increases the thickness of the curves inside the graph, AND the X and Y axis lines. I want to separately style the lines/curves INSIDE the graph, and the border/XY Axis
Thank you - sorry this is probably obvious
(Example below, I want to remove the yellow lines on the X and Y axis)

-
@mjc123 You could try placing the table in a panel that is slightly too small
-
This post is deleted! -
@d-healey sorted, thank you!
-
@mjc123 or just do this:
laf.registerFunction("drawTablePath", function(g, obj)
{
	var thickness = 5.0;
	var area = Rectangle(obj.area).expanded(thickness/2.0); // make the drawing area slightly larger

	g.setColour(obj.bgColour);
    g.drawPath(obj.path, area, thickness);
});