HISE Logo Forum
    • Categories
    • Register
    • Login

    Hide table perimeter lines?

    Scheduled Pinned Locked Moved Scripting
    5 Posts 3 Posters 67 Views
    Loading More Posts
    • Oldest to Newest
    • Newest to Oldest
    • Most Votes
    Reply
    • Reply as topic
    Log in to reply
    This topic has been deleted. Only users with topic management privileges can see it.
    • M
      mjc123
      last edited by

      Hi there, sorry if this is an obvious one, I am very new to HISE!

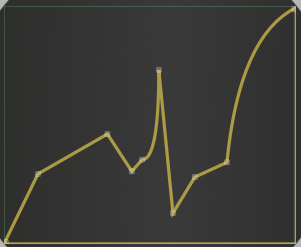
      Is there any way to affect the X and Y axis lines on a table component, while not affecting the curves/lines IN the graph itself?

      I can change the thickness of ALL drawn lines of the table with:

      laf.registerFunction("drawTablePath", function(g, obj)
      {
      	g.setColour(obj.bgColour);
          g.drawPath(obj.path, obj.area, 5.0);
          g.setColour(Colours.withAlpha(obj.bgColour, 0.00));
      
      });
      

      However this increases the thickness of the curves inside the graph, AND the X and Y axis lines. I want to separately style the lines/curves INSIDE the graph, and the border/XY Axis

      Thank you - sorry this is probably obvious

      (Example below, I want to remove the yellow lines on the X and Y axis)

      CleanShot 2025-08-02 at 22.27.42.png

      d.healeyD M 3 Replies Last reply Reply Quote 0
      • d.healeyD
        d.healey @mjc123
        last edited by

        @mjc123 You could try placing the table in a panel that is slightly too small

        Libre Wave - Freedom respecting instruments and effects
        My Patreon - HISE tutorials
        YouTube Channel - Public HISE tutorials

        1 Reply Last reply Reply Quote 0
        • M
          mjc123 @mjc123
          last edited by

          This post is deleted!
          1 Reply Last reply Reply Quote 0
          • M
            mjc123 @mjc123
            last edited by

            @d-healey sorted, thank you!

            ustkU 1 Reply Last reply Reply Quote 1
            • ustkU
              ustk @mjc123
              last edited by ustk

              @mjc123 or just do this:

              laf.registerFunction("drawTablePath", function(g, obj)
              {
              	var thickness = 5.0;
              	var area = Rectangle(obj.area).expanded(thickness/2.0); // make the drawing area slightly larger
              	
              	g.setColour(obj.bgColour);
                  g.drawPath(obj.path, area, thickness);
              });
              

              Can't help pressing F5 in the forum...

              1 Reply Last reply Reply Quote 1
              • First post
                Last post

              25

              Online

              1.9k

              Users

              12.2k

              Topics

              106.6k

              Posts