UI Lag
-
I have had animated UIs run fine in one DAW and completely freeze up the DAW graphics in another.
The performance is always worse on macOS for the same CPU release (year). If it stutters on my M3 Max, I can expect it to just eat up the M1 Air.
- Avoid blurs like the plague until Melatonin gets implemented fully (it's been nearly a year since some functions got it)
- 30 fps should be enough for smaller elements
Generally your problem will be caused by the timer objects calling repaint. If you have multiple, each is calling a repaint and repainting all the elements behind it. To make sure this doesn't happen, put all your fancy plots onto one panel and draw it there. Disable it so that it doesn't consume clicks (so you can actually use the UI), but that will guarantee you only a single timer running without redraw of the background being unnecessarily called, especially if you have heavy graphics in the background (a lot of drop shadows).
If you don't wish to do this, consider adjusting your art direction for the visualizers so that you can set their panels to opaque, preventing redraws of whatever elements are behind them.
If you're not manually refreshing the paint routine on a timer and you're instead using a tile (preferred and much smoother), then there's not much tweaking that you can do, the tile will always attempt to run as fast as possible.
Have you used perfetto or the new profiler to identify how much CPU time is spent on your graphics stuff?
Do you have a weaker test machine where you can also run the profiler and compare?
I dont know if the new profiler can be activated from the plugin so that the user can start a profiling session and send the log back to you. I know Perfetto can be included in the plugin (until it gets removed) but don't know how you would trigger it or if it's at all possible.
-
@aaronventure Threads.startProfiling() can be used for triggering a profile session in compiled plugins but the autocomplete somehow doesn‘t show the method.
And it needs documentation lol, but yeah I would also suggest to profile the UI so you can make an educated guess.
-
@Christoph-Hart does it create a file in App Data or somewhere?
-
@aaronventure Can you please explain that a bit more? Cheers.
-
@aaronventure That's odd. I have tons of stuff going on in my UI…lots of simultaneous timers, almost a thousand translucent components, animation, shaders…nothing has ever slowed down. I even modified the source code so I can run my timers 20x faster than the default limit. I'm only running on an M2. Are there any DAWs where you consistently have problems?
-
Realtime callbacks:
- On Note On
- On Note Off
- On Controller
- On Timer
All accessible as individual sections within the script via the dropdown.
When you call Synth.deferCallbacks(true), it only switches these from the realtime to the message thread. Everything else is message thread by default. The control callbacks are executed synchronously/realtime only if they're triggered by a mapped MIDI controller.
You can also make broadcasters synchronous/realtime.
So if you're not doing anything in these 4 callbacks in your script, that method does nothing. If you're doing anything in them that does not pertain to audio playback (like repainting graphics on your custom keyboard), you're wasting precious realtime CPU cycles and should call the method in on init.
@clevername27 said in UI Lag:
I have tons of stuff going on in my UI
You can have tons of stuff in your UI as long as it's not blurs, drop shadows and large area gradients. A single large area blur will wreck your performance. Drop shadows and gradients are fine in smaller numbers but if you make 50-60 calls it's gonna become noticeable. One example is doing something fancy for your background (large area with a lot of drop shadows and gradients), which then has to get redrawn any time you touch any of the components that are on top of it.
-
First off great discussion and thanks for all your input, it’s giving me a better sense on how I might debug this issue and future challenges. In answer to your questions:
- @orange Yes I have
Synth.deferCallbacks(true);set already. - No blur’s or drop shadows (I've learned my lesson). Most of the graphics (background, buttons) are done in png, but the sliders are simple LAF and the animations use panels drawing paths. I do use gradients for filling some of these so that may be room for concern (I will try removing these next)
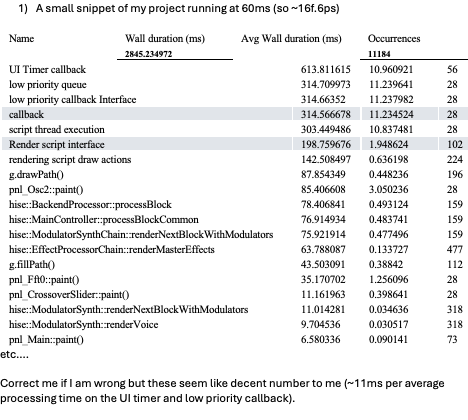
- @aaronventure thanks for all of your input. I have run Perfetto a few times on Windows and on Mac. The bulk of any CPU or GPU consumption are from the UI timer callback. Individually they seem negligible but I suppose it’s the frequency they are called and causing repaints which must be the issue. Are you suggesting to just create 1 panel to host all repaints and divide it into separate sections "put all your fancy plots onto one panel and draw it there".
-
@Christoph-Hart pray tell what Threads.startProfiling() is! I've used Perfetto as well as the VIsual Studio debugging tools but I haven't seen any abnormal behaviour.
-
@clevername27 you said you have numerous timers, animations, shadrs, etc. Does the performance transfer across different OS?
-
DAWs generally: It seems like a majority of reports are Ableton and Logic. I am generally an Albeotn user and I haven't had many issues on my M2 with it, but I do recall serious UI lags in the past on my Windows (pre-2024). There are a couple of posts on the JUCE forum regarding this: https://forum.juce.com/t/plug-in-ui-doesnt-work-on-certain-versions-of-ableton-live-12-windows/62563 & https://forum.juce.com/t/juce-plugins-cause-poor-daw-ui-performance-on-windows/55034
However, in this particular case it doesn't seem to be DAW specific.
- @orange Yes I have
-
@aaronventure Interesting. If helpful, here's how I deal with that stuff with low overhead:
I pre-render all shadows—just the shadows, and drawing the HISE components on top. And I can resize them without pixelation (like if the user resizes the interface).
In this interface, I wanted to animate the shadows. So there's a PNG with and without them. When the plugin starts, I fade in second image, and the panels appear to rise out of the interface. By slicing the shadowed PNG into five images, each panel can rise and fall independently.
For gradients, I just use a tiny, pre-made as PNG. I can scale it to any dimension or aspect ratio, and it never bands. And if I still need an alpha, it's an image—so that's easy, too.
-
@HISEnberg said in UI Lag:
@clevername27 you said you have numerous timers, animations, shadrs, etc. Does the performance transfer across different OS?
My plugins only run on one computer, so I don't know. I'm guessing the Windows OS would be a little faster for this.
-
@clevername27 Of course it's possible to pre-render this stuff, but keep in mind that HISE decompresses the loaded PNGs, so a scaling-friendly full-size image for a 1400x1000 interface (an image of 2800x2000 that might be compressed as a PNG down to 1.6 MB or less ends up being 21MB in RAM when loaded into HISE. And it's bitmap, so it doesn't care about alpha channel, it still takes up memory.
So that's for every layer that you use, for every instance of your plugin.
Admittedly you might not need retina resolution for shadows so the footprint will be 4x less in that case.
-
@HISEnberg
Have you found a solution? I think I have the same problem. -
@Oli-Ullmann hmm I don't think so. I am in a precarious position where I don't want to release a new version of this specific plugin with the same issues again so I am defaulting back to the standard FFT. We carried the conversation over to this thread:
https://forum.hise.audio/topic/12626/fft-analyser-path-need-help-drawing-the-magnitude-to-height/15
I also created that profiling script so you can get a snapshot of the users experience. I think that is a pretty useful tool but only if your users are willing to help you debug the issues.
-
@HISEnberg
Thanks to you. I haven't found a solution yet either, but I'll post a comment here if I get any further.