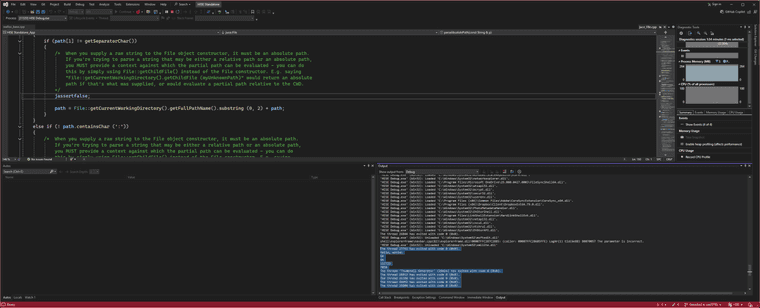
Getting debug output to the compiler console..
-
@d-healey the debug build now tells me this:
c:\hise\hi_modules\modulators\mods\controlmodulator.cpp(261): error C2280: 'juce::String &juce::operator <<(juce::String &,bool)': attempting to reference a deleted function (compiling source file ....\JuceLibraryCode\include_hi_modules_01.cpp)
-- thats the line with one of the DBG statement in it...but tis one thats trying to show me a value - so I'm asking it not to send a string but a bool, hmm, wonder if I have to cast this somehow...
-
@Lindon - OK I got the debug version to compile - still nothing coming out of the output window.... even for simple "we are here" text
Meanwhile teh debug tells me this:
Exception thrown at 0x00007FFA25C24ED9 in HISE Debug.exe: Microsoft C++ exception: hise::HiseJavascriptEngine::RootObject::Error at memory location 0x000000F59DD2EB48.
Which I think has NOTHING to do with my problem....so either
A. I dont know what I'm doing and the DBG statements are going somewhere else...<-- quite possible
or
B. none of the aftertouch code is getting executed at all
-
@Lindon Try putting the DBG somewhere else - like at the start of main, so you can rule out (a)
-
@d-healey -- and "Main" is where in HISE?
-
My guess is mainController.cpp is doing the same thing that
mainusually does. -
@d-healey - yep that was my guess too so I put this in there:
/** The entire HISE codebase


*/
namespace hise { using namespace juce;

#if HI_RUN_UNIT_TESTS
bool MainController::unitTestMode = false;
#endif

DBG("in here at the start");

MainController::MainController() :

	sampleManager(new SampleManager(this)),
	javascriptThreadPool(new JavascriptThreadPool(this)),
	expansionHandler(this),
	allNotesOffFlag(false),
	maxBufferSize(-1),
	cpuBufferSize(0),
...
...
...
Compiled a release version and ran it -----
nothing showed up in the output window, so - its looking like a. (I dont know what I'm doing, not surprising...)
Where does DBG send statements to?
more research shows this:
DBG( "message" );
messages only show up in the output window in your IDE in debug builds, not release builds.
If you want to know how it works, right click on it, “Go to definition” and look at the source code. it’s just a macro.use breakpoints. Xcode and Visual Studio have great support for breakpoints and debugging.
-
Where does DBG send statements to?
I work in the terminal so that's where I see the output. Someone else was asking me about debugging in VS a while ago, I suggested they search YouTube and find some proper instructions for debugging - I'll be doing this too when I do my next Windows build - they seemed to find it helpful.
-
@d-healey well I built another debug image - and still nothing is showing up... so youTube might be my next port of call...
- is this any easier in MacOS?
-
@Lindon I'm a GNU/Linux guy :) You can debug on Windows and MacOS using the terminal though. Make a debug build and run it from the terminal.
-
The DBG call must be inside a function body and is only available in Debug builds (hence the name). In your example you‘ve put it into global namespace which is basically a vacuum in C++.
-
@Christoph-Hart - yep I worked that out so I put it in the function...still I'm not seeing any output....:-(
-
@Christoph-Hart Sent you a message.
-
Hey apologies for the bump. But I got this to work by putting:
JUCE_LOG_ASSERTIONS=1into the preprocessor definitions and then rebuilding. I get data from my custom c++ node printing to the visual studio log:

It wasn't working until I did that.