GUI for the Parametric EQ
-
Hello !
i would like to know if it's possible to make a GUI for the parametric EQ as you did for the Dynamic module in your Github example ?the graphical interface/modulation for the EQ is powerful.
-
up ?
just an answer please ? :D -
I might add this as floating tile so you can connect it to your curve EQ, but drawing this with pure scripting (like the Dynamics widget) is a bit difficult because you have to calculate the filter response from the coefficients which is about 18x as complicated as the Dynamics code.
-
@christoph-hart Has there been any update to this? Or documentation on skinning the Parametriq EQ? Would love to add these controls to my GUI.
-
This is on my roadmap for quite some time now. Unfortunately drawing a frequency response is not as easy as the dynamic meter (lot's of math wizardry with complex numbers involved), but I think about adding the curve eq plot as a floating tile.
-
it would be great, with a color, line shape (thickness, fill color...etc) customisation....
-
@christoph-hart Is there a simpler, fix band type eq that could be implemented more easily?
-
Or maybe a doc on Script FX? Is it possible to throw in an open source EQ script into that slot?
-
@Christoph-Hart I just realized that control over the EQ parameter knobs IS functional.
 Very exciting!
If you have 2 different EQ points set in the parametric EQ, how can you differentiate the knob controls between each node? By default, they control node 0. -
Just multiply it with the band index :)
inline function onBand2GainControl(component, value)
{
    // Use the BandOffset as multiplier to get the correct attribute index
    local index = 1 * ParametriqEQ.BandOffset + ParametriqEQ.Gain;
    ParametriqEQ.setAttribute(index, value);
};
Example patch:
HiseSnippet 1123.3ocyW0rbaaCDFTxrSsRkSxL8A.imdPtM0gTx1wYxzIxR1tilFaqTk3o2RgHgjPLH.CInsUxjY5qg6o1GidKOJ8QHW6o1EjThjxJtRGZZvMr+gu8iK1ErafzgFFJCPF25Yi8oHiuvr2XgZT6QDl.0YejwZlGQBUz.bhnVi8IggTWjgQ4uWKvX0UPwq2+3VDNQ3PyDgPmJYNzmv7XpLo9M+AFmeHwk9LlWNq2pYGGonsjKi.7T1zB4SbNiLjdLQaVISz4L5EgHCKyF02L3L69uduMmY09Is.YCKJG4DEDPEpSA2QFlF+MrLLOvkojA8TDEEhY4VR2w8FIuPjbzmxBY84T8FaTO.SIhQsGw3tcmPagHjwJcyHwxIj3WZdDykMUdFYdmXE3LOxSmFkJBoUJ.I6ODjNTxc0A3C.OibvakD3cWydNALeUlFM1tkYGA7cd.A9BlGVI1hJ0orYaIXgPsoG4L5gAvlodTaGKq6gssr13QUqTsB7cLTgOmDf6RBfudp.1qN3o3uCGWbs4Pp5fACnNpZqmoGevSWOwalfyDT7fHgihIEXonEQ3ZqK2zHHPxq4H87kB.K2CNEdDcipUdS0JXXc+6iedHEqFQwZuNYvfPpBSBwdQbEymyfRYkDCPH1FGITZ3.Fn.LzORQwLgK8xjXwkNDdh..6V3utP5rYt3+ME0ng5iRhQ0JqVPEX8dSNqZwgdRJ.N7137eBMCXr8j7r15S4f02PGjTlnMgy6CWSpccR5lHy5KFYVj.r++m.p+uQ.0mg.xk2GKUzSD01nxaprZk2dMMCFLOUoghSClmVcCrfavsZhHu9zfIIXpcvEwh2z+rE6ltSBsjyPonifoNwmltOqWf8b5EfR4UnqPoT.Blph6IrVZOgdblKM.wb0MDlVQghweZq5lMZb6lnEN.0uV.9sqtx5cnm2Yehhn6PkBK.p9z.ESyHF6SOGlbjzuZUy8ogmoj9w3Nsd.FUsPH+xoCX9YRywYSa1t4ELW0H87feA1NhxFNRo2AcQQdR2zy0g0mxQd4GzU+cdjKyssILdzuG60wo2udkd8GONLZv.FXkoI1sE3uqKm1UFxz0G4GPhVhDp9LIz6OOeB03SjD55yafodR2HNQUbTnNaRUniQ9YN54JBH1iy+7hkX9n0bmON26DKHbuqYWlxYz7wao4fW8kr+iwa5qMpZlLLMCrqXd3O8Q9oEqM4pZ6nfyoG7pXbbayBi2K.oii7NjwgmODpqQKAYltD2JeOl3KwS5Y7W6RiETu3KNEtMlUvVYBtSrKamuuiVvNoB9yu5k+drEOX1Xr6rBdX9fZT9ld7n8h+3QzOJiTLwviH.EoubArRO34uNT3ioPP4SImz8V58ZPziFSVIOlMUosduQpR6IJ+nbFdDm.4KbRlInqM97XIPdKhe79pveQ.6w1SFDn4CnIB6ENN550uEp0muG0WZOZrzdr0R6w1KsG6rzd7fk1icuAOz+3wdQJoWR2KD5e.56iySA -
-
@christoph-hart is there a way to see the code associated with the WYSIWYG editor?
-
Not sure what you mean with " code associated with the WYSIWYG editor?"
Anyways, I have added a floating tile that shows the filter graph. It can be connected to either a parametriq EQ or to (mono / poly) filter effects:
It's just read only so you can't drag the curves, but this shouldn't be too much of a restriction...
-
@christoph-hart said in GUI for the Parametric EQ:
Not sure what you mean with " code associated with the WYSIWYG editor?"
Anyways, I have added a floating tile that shows the filter graph. It can be connected to either a parametriq EQ or to (mono / poly) filter effects:
It's just read only so you can't drag the curves, but this shouldn't be too much of a restriction...
hi im new to hise
can you expaln how to do the floating tile as the filter graph (i got the knobs connetected to a parametriq eq & got the floating tile connetected to the FilterDisplay but nothing is displayed in the floating tile.)
thanks
-
Hi there,
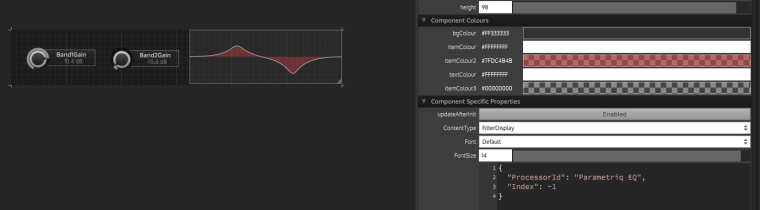
- Add a floating tile
- Set the
ContentTypeproperty toFilterDisplay - Set the
ProcessorIdparameter to the name of the Parametric EQ module (by defaultParametriq EQ) that you want to connect and press F5.
-
@christoph-hart Thanks
-
Can someone save me some time with trial and error? Is this supposed to go like this for the Frequency and Q parameters?
local index = 0 * ParametriqEQ.BandOffset + ParametriqEQ.Gain;
local index = 1 * ParametriqEQ.BandOffset + ParametriqEQ.Frequency;
local index = 2 * ParametriqEQ.BandOffset + ParametriqEQ.Q; -
This post is deleted! -
@dustbro said in Stereo Effect Project. Example?:
@duno I was wondering the same thing, so I decided to do a little test.
By using the Console.print() command, I was able to see that ParametriqEQ.BandOffset is an Integer that is equal to 5. By doing the same with ParametriqEQ.Gain, I saw that was equal to 0.
These are Index numbers that dictate which control you are scripting.
Looking at the Module browser, I can see that each EQ has 6 Index points for each EQ node:

The first 5 appear to be controls, and the BandOffset is just an index used to multiply.
At EQ Node 0, the index is:
0 - Gain
1 - Freq
2 - Q
3 - Enabled
4 - Type
So what happens when you have another EQ node in the effect? The index list starts over at 5.
5 - Gain
6- Freq
7 - Q
8 - Enabled
9 - Type
And then the next node would start at 10.
So what does it all mean?? lets do some math.{ local index = 1 * ParametriqEQ.BandOffset + ParametriqEQ.Gain; ParametriqEQ.setAttribute(index, value); };In the script above we're creating a local variable called index. This is used to gather an integer that is directly related to a specific index on the EQ.
If we convert them to numbers, the equation looks like this:
1 * BandOffset + Gain
or
1 * 5 + 0 = 5
5 is now passed to the line of code below:ParametriqEQ.setAttribute(index, value);Which is the same as if we typed:
ParametriqEQ.setAttribute(5, value);Looking at the chart above, we can see that Index 5 is the Gain of 2nd EQ node.
-
@dustbro nice one man! That should help me lots!
