Forum
    • Categories
    • Register
    • Login

    How do I remove or mask out sections of a path?

    Scheduled Pinned Locked Moved General Questions
    5 Posts 2 Posters 36 Views
    Loading More Posts
    • Oldest to Newest
    • Newest to Oldest
    • Most Votes
    Reply
    • Reply as topic
    Log in to reply
    This topic has been deleted. Only users with topic management privileges can see it.
    • OrvillainO
      Orvillain
      last edited by

      namespace UILFOPlotter
      {
          
          const lfoPlotters = [
              Content.getComponent("PlotterLFO1"),
              Content.getComponent("PlotterLFO2"),
              Content.getComponent("PlotterLFO3")
          ];
      
          reg laf = undefined;
      
          inline function init()
          {
              laf = UILAF.ids.LFOPlotter;
      
              if (laf != undefined)
              {
                  laf.registerFunction("drawAnalyserBackground", function(g, obj)
                  {
                      g.fillAll(UIColours.modPanelBackground);
                  });
      
                  laf.registerFunction("drawAnalyserGrid", function(g, obj)
                  {
                      
                  });
      
                  laf.registerFunction("drawAnalyserPath", function(g, obj)
                  {
                      g.setColour(UIColours.modLFOLine);
                      
                      // draw the analyser path as a stroked line instead of a filled area
                      g.drawPath(obj.path, obj.area, 2.0);
                  });
              }
      
              for (plotter in lfoPlotters)
              {
                  plotter.setLocalLookAndFeel(laf);
                  plotter.set("itemColour3", 0);
                  plotter.set("bgColour", 0);
                  plotter.set("itemColour", 0);
                  plotter.set("itemColour2", 0);
                  plotter.set("textColour", 0);
              }
          }
      }
      

      960accb5-7fa3-47e6-9448-f4b2deac736d-image.png

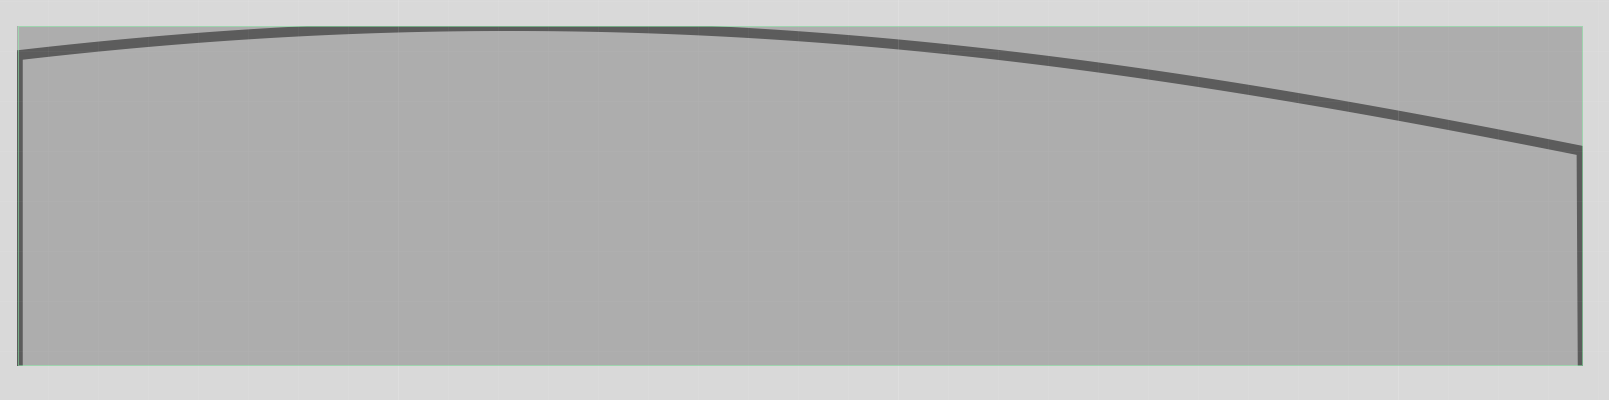
      I have a floating tile set to plot the output of an LFO. I am setting up a look and feel and I'm registering the drawAnalyserPath function. As you can see it is working, but the drawn path has two issues:

      1 - It draws too far on the vertical axis; meaning my line gets clipped by the bounding box of the panel.
      2 - It draws the, presumably zero, data points at the far left and far right edges of the panel.

      How can I fix these two issues?

      Musician - Instrument Designer - Sonic Architect - Creative Product Owner
      Crafting sound at every level. From strings to signal paths, samples to systems.

      dannytaurusD 1 Reply Last reply Reply Quote 0
      • OrvillainO
        Orvillain
        last edited by

        Oh... wait... I get it.... tweak the draw area for the vertical fix, and draw coloured boxes over the edges to mask it all out.

                    laf.registerFunction("drawAnalyserPath", function(g, obj)
                    {
                        var a = obj.area;
                        var stroke = 2.0;
                        var pad = 2;
                        var a2 = [ a[0], a[1] + pad, a[2], a[3] - 2*pad ];
        
                        g.setColour(UIColours.modLFOLine);
                        g.drawPath(obj.path, a2, stroke);
        
                        var cover = 4;
                        g.setColour(UIColours.modPanelBackground);
                        g.fillRect([a[0] - cover, a[1] - 1, cover * 2, a[3] + 2]);
                        g.fillRect([a[0] + a[2] - cover, a[1] - 1, cover * 2, a[3] + 2]);
                    });
        

        Musician - Instrument Designer - Sonic Architect - Creative Product Owner
        Crafting sound at every level. From strings to signal paths, samples to systems.

        1 Reply Last reply Reply Quote 0
        • dannytaurusD
          dannytaurus @Orvillain
          last edited by dannytaurus

          @Orvillain I put the floating tile inside a panel then resize and offset the plotter.

          Panel = 180x50
          Plotter = 182x48 at x,y -1,1

          Making the plotter wider by 2px and shifting left by 1px cuts off the lines down to zero on each side.
          Making the plotter 2px shorter than the panel and sitting it 1px down on the y stops the curve cutting off at the top and bottom.

          CleanShot 2025-12-15 at 14.09.08.gif

          Meat Beats: https://meatbeats.com
          Klippr Video: https://klippr.video

          OrvillainO 1 Reply Last reply Reply Quote 0
          • OrvillainO
            Orvillain @dannytaurus
            last edited by

            @dannytaurus Pretty similar to my fix above too. I just wanted a LAF solution rather than another panel hierarchy!

            Musician - Instrument Designer - Sonic Architect - Creative Product Owner
            Crafting sound at every level. From strings to signal paths, samples to systems.

            dannytaurusD 1 Reply Last reply Reply Quote 0
            • dannytaurusD
              dannytaurus @Orvillain
              last edited by dannytaurus

              @Orvillain You can set up the hierarchy in your script I guess. Then at least you have it all in one place.

              Meat Beats: https://meatbeats.com
              Klippr Video: https://klippr.video

              1 Reply Last reply Reply Quote 0
              • First post
                Last post

              22

              Online

              2.1k

              Users

              13.1k

              Topics

              113.3k

              Posts