Display output levels.
-
Hi, I am new to HISE. I have been watching many videos by David Healy and read many different forums and found them to be very helpful. I have managed to do several things I need to, but there are some things that I can't find the answer to or get my head around.
I am creating a sample based instrument and for the last section of the plug-in there will be a L&R out displaying their Peak Levels before they touch the compressor > then the Compressor = Amount of Compression > Limiter = Amount of Compression > Master out = Peak Levels.
There will be a knob for both the left & right output to turn them up for down before the compressor, then a knob for the threshold of the Compressor & Limiter, then a knob for the overall output. Above each Knob in this section I would like there to be a small rectangle display above each one, displaying the output levels in db, for example; L = 18.1db > R = -17.5db > Compression = -3.5db > Limiter = -1.0 db & Master = -0.2db.
I have managed to work out how to display the amount of Compression & Limiter being applied with a VU Meter, but I don't want a VU meter just the values displayed in the boxes provided. Does anyone knob how to do this?
There will also be a different section where I'd like to display the tempo & feedback etc of the Delay in the empty rectangles provided above the knobs, displaying the changes being made.
I would also like to Tempo Sync the ADSR of each group of sampled instruments. So for example; Synth 1 could have the attack time of 1/4 & Synth 2 with the attack time of 1/8 etc.
If anyone has any idea of how to achieve the issues I have listed above, I would be very grateful.
Thanks.
-
@Delamere said in Display output levels.:
I don't want a VU meter just the values displayed in the boxes provided. Does anyone knob how to do this?
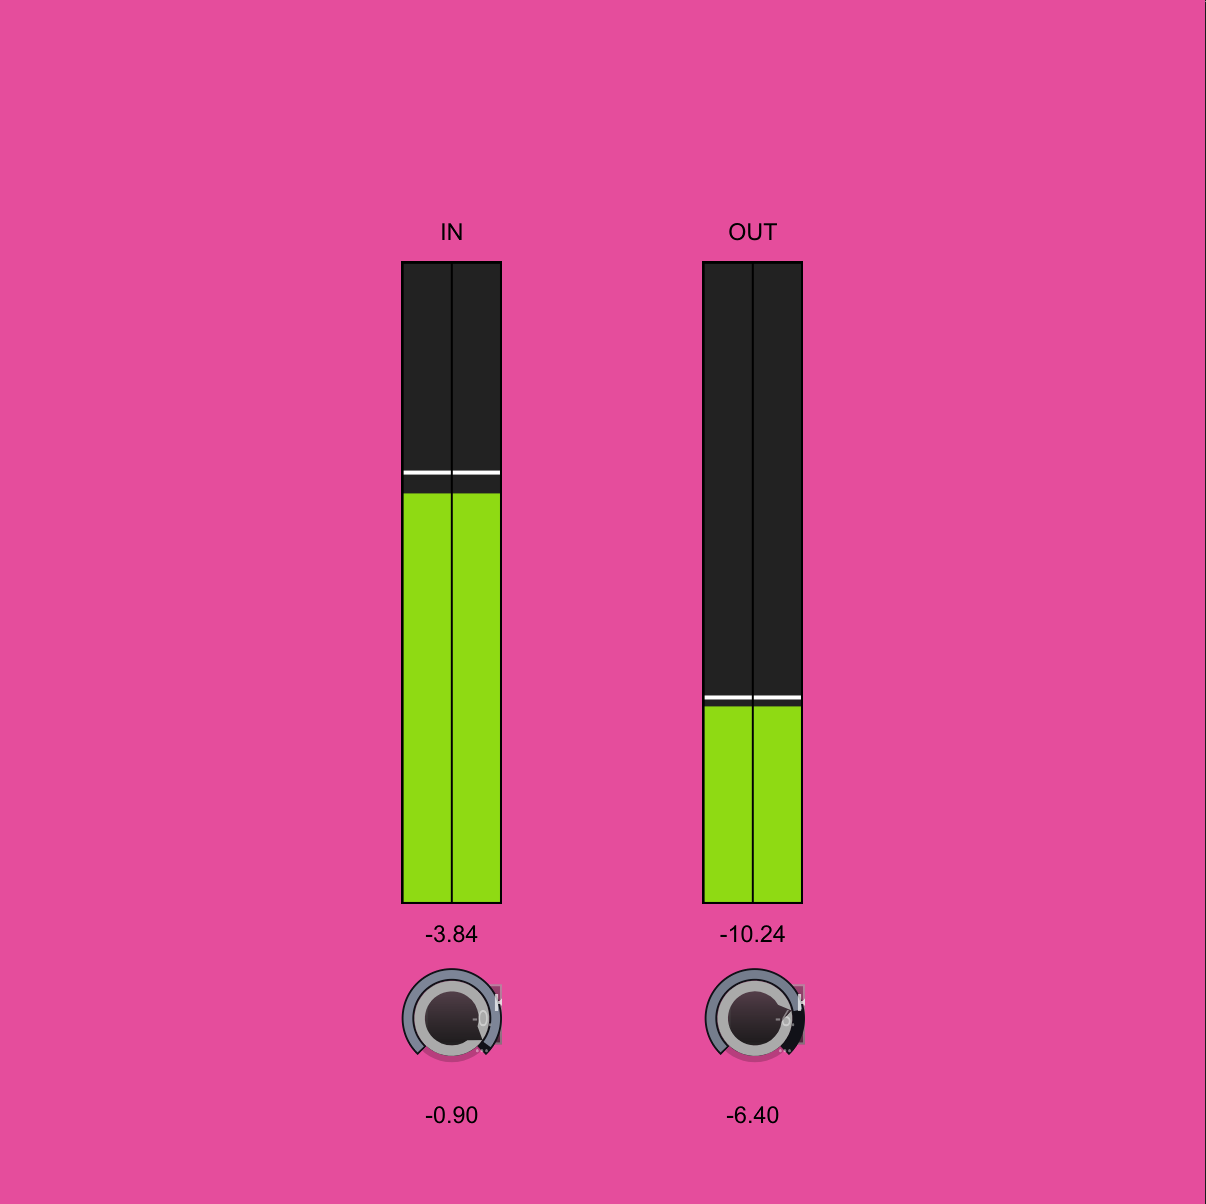
You can style the peak meter floating tile using look and feel to do this.
That's how I created the peak meter in Sordina.

There are two floating tiles here, one for the meter and the one underneath for the text.
-
@Delamere said in Display output levels.:
I have managed to work out how to display the amount of Compression & Limiter being applied with a VU Meter, but I don't want a VU meter just the values displayed in the boxes provided. Does anyone knob how to do this?
so you will have a simple gain before and after your effects, get a reference to these and use .getCurrnetlLevel(x); (x=0 is right, x = 1 is Left)
Then use a timer in a panel to display these.
https://docs.hise.dev/scripting/scripting-api/effect/index.html#getcurrentlevel
HISE Development for hire.
www.channelrobot.com -
@Lindon said in Display output levels.:
Then use a timer in a panel to display these.
Why not use a peak meter tile?
Free HISE Bootcamp Full Course for beginners.
YouTube Channel - HISE tutorials
My Patreon - More HISE tutorials -
@d-healey Hi David, thank you for the reply. I am completely new to this and don't understand how to connect the Peak Meter to the L&R output etc or how to change the way it looks to be only the values without the meter? Thanks.
-
@Delamere said in Display output levels.:
I am completely new to this
That's a good place to start :)
@Delamere said in Display output levels.:
how to connect the Peak Meter to the L&R output
Set the peak meter's processor id (in the Data property) to the id of your simple gain (or any other module you want that has a peak meter).
Set the Channelndexes to
[0,1]. So it looks something like this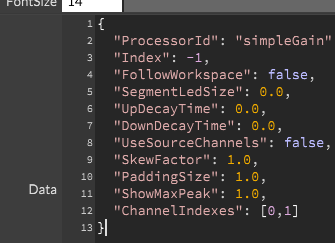
Then go and learn about local look and feel so you can change the appearance.
Here's a guide, but instead of using
Engine.createGlobalScriptLookAndFeel()useContent.createLocalLookAndFeel();
https://docs.hise.audio/glossary/custom_lookandfeel.html#getting-started -
@Lindon Hi Lindon, thank you for the reply. If I click on 'Create generic script reference' in the group of the master FX section, I'm not able to paste it into my script. only each individual effect. Also, Where do I put the .getCurrentLevel after the simple gain?
const var SimpleGain1 = Synth.getEffect("Simple Gain1");
Sorry, I am completely new to this and don't know anything about scripting, only from what I've learnt watching videos about hise & reading forums.
Thanks.
-
@d-healey Hi David, I have done what you said & there is a peak meter showing the left & right output levels for the Simple Gain, but there is no value coming up and I don't know how to take the meter off. I have read through the link you sent and I just can't work out how to do it. I only need a little display saying the db peak levels, like at the bottom of the meter you showed. But with the db for the left peak out as one little rectangle & then the db for the right peak out as another little rectangle, which I can put above the left knob & right knob. Do you have any advice or videos on how to do that? Thanks.
-
@Delamere said in Display output levels.:
Do you have any advice or videos on how to do that?
Start by learning paint routines and look and feel - do this in a separate "playground" project where you can just try things out and see how it works.
I have a few videos on my channel about paint routines and look and feel. Just be sure to use local look and feel and not global look and feel - some of my older videos only use the latter because local wasn't available at the time.
-
@Delamere I had some time so I made this example for you.
HiseSnippet 2321.3oc6Zs0aabbEdWIsNhqiccBBR7SECH5CTEJxjqrcsiQfkDEoKgDEIHoriQPP5vcGJtQK2gY2Y0kl5h92nE8OReS+.7C8mPdou625itmY1KbVxkTTxJtUElBPXmamKemyblyb1soG0j36S8TT06b5Phh5Gq09TWV+x8w1tJ01VQ8tZMI3CqSXDucwcIN9UNAOXnCQYqSGh88IVJppK9L9rUysjh32ad5VXGrqIYTWJJOmZaR10dfMaTuM2XGaGmpXKRG6ARy99aTyj5Vl5PC.IaQshJCwlGhOfrGlOsEzT98X+9Jp+VMCidlOpXwGs95OnHFutEFe+Rj0eLo2C6Y9fhOtnU2GTD96gJp2nhkMi50lgYDefnaQsNsce5wtgL34191cAsBZTRoMv4vtUJ221wpYLL4qnnp0bDnsXHn8YZ0ssrS5eD3cGw.nQqPFzTWXVhToKfHoJIRKEJRehVaSO6grQivkmapUyELj8vlosegyUYg+8xZkovLbYqM.eHopGzHYEEdXwhqhf+sxSz00yomCrQ9LzQXOTMWtG.2H5g9ZTE2CrcIqY5Q.ESzYit+.wjUXkmft28PkE8iBmc3HndTOT9PpjWlvMBXWETNhL4SK0NccBY41aAzNVwOfvJSGLj5BMJjWZN4CYRXSjXyvXTKhMylbISJhdQsiH3XTbGWZ2ROG6DPlEIGMqHZx6.UBEtPFMSgkOGi4hzFSPZiIHc3ei6Q.TVDNgS2J85wsTwV4Tf48.i+d4QhnLHaezwXlYea2CPr9PqATq.GxZY3WjE8is0oQWfCM1uy4wBjLO19TW7.aS+RYwkjAi3yKoAIK.nhN2arUkM6TA0oV8JsPk2b2c2Zyx6fp1nUnx1rxl6fpWoSkV5RaeVymvDOTF63zEh5UnWfqIyl5VXE8eBbOFAtB2rvGE1s.OOvpsK4HhSgus3pk9NXeZpouWiWLZODrhsIl17H5Uod7ITEaBQiJDOa9pk794BVg7LxIr7qFSCKZ.DfpCsMyCPxBR7YUjwJq7jb4xo+JfNozOF1KTCg3IgXWaBCcJDpGwDab6S7HnBfMaf+J5mCPJroRHotb.i4BKk2yF87rQyjELevYxzivyj1yAfJypzHZZ07hCo6rWisPkarWmVM1ss9HedQjjoFOPLZdd3+XRTh6Kid1lfCstsqCnCnXLFQcEymSJOpSAyX5rJvIH3A2DjytGpPTqbPybQty.zrICvftALRghwK..vboh1MGPnXkgXmdtWo+pmnOSUiSwHANwoIsdHq8FBGvH0OMHZLSPzP.hYCXFWH.K1kcLDaB.y3WB.yXV.lgDfE8SRS2ixHMB2GBdz5nwGpWuLGKhlNfqdVCGtIXFKrfavftDOYDkOQHsoz4hci4KWLyPnQZhT2Zt1rFCIQsqRcr34XwedxL2ThvVHGtEhjPXpLQFb2NJCt1N1VDOEafHejlvSTQH7QoKe1q2c8yTl6EaL1hec9yT1u11XFlmGYj3.h3PhGyliDpaSNBxbOLqxbZaS7OjQGBOl3K.2cHjo2JNmSrKwQvyk0DOWR4D4qBbpbiissXPp7ZpeyBJJ8I1GzmE2pK0CD911+wTWjHr2VXK6.e49sYjAwWYH2M960+WuMcuFxcyg6Dwe4zhuHiFg3+qzREtQVKr2XjV7y+kMFh4mVHSyXMOQ+LTj0ueMzhuOjOyurziWacdh8WDQxXbQ5mCtxDoOR6Ke7Z2OsDcSVzUcBknpNTLChWzwF1UDJXxcUZZX0F+gMhbxhumRcLD34jjKYpz8fQVQXAucRa696ueV1174yK5V3LuvWnp8S5HT9jsa0rx+UI2wXU9P0bsHm.cVRzB1o5PO9ETuC8gaaRf96gc7IhwZSNXfHa.Kt2HLTw0JJFX+gvo93S4wcj5caHbPV8uuOoMHslD3FhtfovOMSNjbbXRCbYJZIMwVV.lFw13d4AbpiEflTuQTUnVDNs+VnWDRLHBUB9+2o+poY82PU4cvdaLMGw2a166ls8N91.evfedF7oFx4lZIWCXZ6pUd4FmaPkkzpsm3wIM2ykX7wZixddZdayibnoA4r8tHH2RS5ZQSCQP+oyWRxAQ9KBtJEeWjlaqIeohoALW0hysN2bTllmxedZBBuEbM7nrLDWkRYfbYEe4YCvoxivmQFFmcve6ux+8OdpePud1mvsxHqsf0aY4PZR8s4oAxmmpXkFm4Can5.p4VzS3E.6hnaxw5dSv0.caxpCdGs57BdfYoKVI2GJZ.NIkqPHuJft.qNUtLuWfJXVblUvbdEwOQqoMyre1x3BYHi7L89EPFip66szBKGzHAbIspeyksHuyl8pKJw+kSJVuMuV7OKl8KqEEmdJEmWbYgsIN3TPzKBcZGECMix2Wy8H3FAMoNXuwA3EupJi8RysWfnjduKdpKMelgy41ayo79oZBH+5j.KbIt9Hv2ge0l+GPbaQC3YDGlhKDndufAoy+ieXvB7iRCaWj2lKPsItVhFuE9EMXIda0nAKEOnLj7ogPhtVbkmidIOIEmdr3.LREWLnUVx6e4c2ouGAN0vYhA1jwvlGJCb7daQbHXehbHC94mdBwJCVLZvLYzngawsdxbazPiKI+FIVlg7HdSijrDlnQxTRhFaRsNZfIXjrTTGeHIXXFjaxAtxhY991iaZG7jSKNy7odxyqy+gSd9vIOe3jm+u3jmaGBI2DhC3RDubTAZ74h1nWfOhfdFwk3wAqRy3SE4eNuepHCm6OUjFlLf8c7vt9Co9oHbax.6Nvs7RU2388IU8H+3XG8vOUB6k4Pu4oUAkLy0zFyB7D9AaNfF3xlUzpklunUouSlz7OmvXWoeZJum2R8es6gl5KoIWrLFdVWE3bHGJzSbf0d3.GVbuocxqScoC6ScsMk8.ZQfMmGb.wSV1yTgFOAjOaiLx7XWvKD6UOrrBWFr3h+UEko85tZghq36t45Sj6YVKgEmqZIbkKuW95Jb84Tj2G7X.1zi98lguTTtu7xhd.81U7EDlSqNuMJ8qRU7a.DU76MMSSpIVnwkcgqeYW38urK7AW1E9vK6B+cW1E9nyeg7Cs1LfQGDtkUQodyJhW.jpZxc8TWT4+.ni1vlL -
@Chazrox Hi, thanks for this example, I appreciate you taking the time to make this. I'm finding it very helpful. Just trying to understand what everything means.
Thanks.
-
@d-healey Ok thanks David.
-
@d-healey said in Display output levels.:
@Lindon said in Display output levels.:
Then use a timer in a panel to display these.
Why not use a peak meter tile?
'cause I cant seem to make the peak meter work horizontally...
EDIT: oh the forum gods just struck - and now I can....
its a pity we cant set some warning and overs colours... so anything over -6 = orange anything over 0 = red...
HISE Development for hire.
www.channelrobot.com -
@Lindon you can with laf
Free HISE Bootcamp Full Course for beginners.
YouTube Channel - HISE tutorials
My Patreon - More HISE tutorials -