Anybody understand what Sine Shaping Distortion does / how to make it?
-
@griffinboy perhaps?!
Finding lots of half answered waffle online

DHPlugins / DC Breaks | Artist / Producer / DJ / Developer
https://dhplugins.com/ | https://dcbreaks.com/
London, UK -
I may be wrong, but I'd guess it's just waveshaping using the sine function.
If you know how tahn works / waveshaping in general, it's that, but just using a sine wave.
Waveshaping takes a waveform (represented in samples) and maps each input value to an output value, doing a direct transformation on the wave
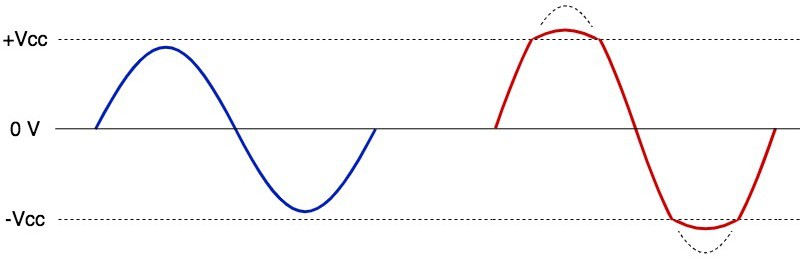
Look at the sine waveform on the left, in digital audio the x-axis represents time, and y-axis is the amplitude of each sample.
That's what we have in our audio buffer.
A bunch of samples with oscillating values (y axis) to form the sine.To waveshape, we go through each sample, and look at the y value (amplitude) and using the waveshaper function, we transform that value to a new value. Doing that for each sample yields the distorted sound.
Using a sine as the waveshaper just means that we use sin() and pass each sample into the sin() function. The picture above isn't for sine waveshaping but rather pictures something similar to tahn.
-
Maybe I've been living under a rock, but I haven't heard of a sine shaper before, so this piqued my interest. It's a type of non-linear waveshaper that folds the input signal back onto itself in a sinusoidal pattern. Apparently, it produces a smooth and natural-sounding harmonic generation.
There's some analysis here:
http://www.openmusiclabs.com/files/otasine.pdfThe formula seems to be pretty simple:
output = sin(foldAmount * asin(input));
// foldAmount controls how much the wave folds.
I threw together a quick Octave script to see what's going on.
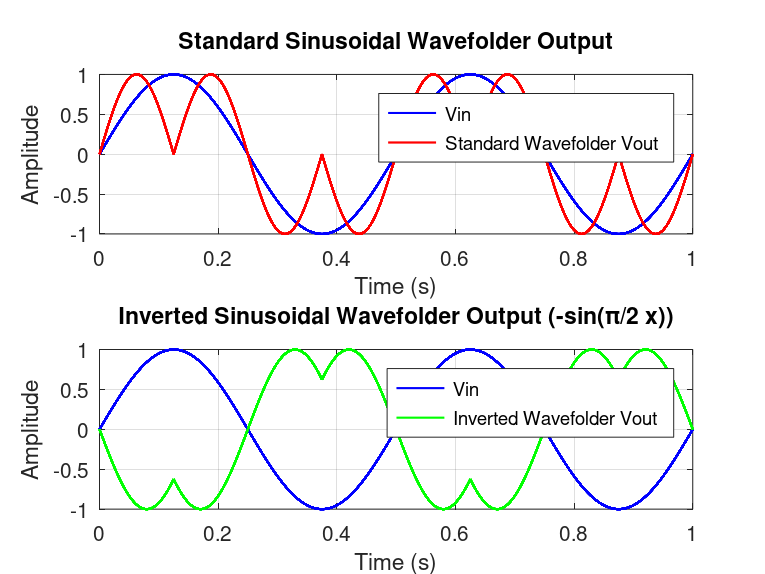
Here's the Octave script if you want to play around with it:
% Korneff - Sinusoidal Wavefolder Variations
clear; clc; close all;

Fs = 48e3;        % Sampling frequency 48 kHz

%% Choose Input Type: 'sine', 'impulse', or 'dc_sweep'
inputType = 'sine'; % <-- Change to 'sine', 'impulse', or 'dc_sweep'

%% Input Signal Setup
switch inputType
    case 'sine'
        f = 2;              % Frequency of sine wave (2 Hz)
        duration = 2/f;     % Duration = 2 cycles (2 periods)
        T = 0:1/Fs:duration;
        Vin = sin(2*pi*f*T)'; % Column vector for Vin
    case 'impulse'
        N = 2048;
        Vin = [1; zeros(N-1, 1)];
        T = (0:N-1)/Fs;
    case 'dc_sweep'
        N = 500;                      % Number of sweep points
        Vin = linspace(-1, 1, N)';    % DC sweep from -1 to 1 V
        T = Vin;                      % Use sweep voltage as x-axis
    otherwise
        error('Invalid inputType selected. Choose ''sine'', ''impulse'', or ''dc_sweep''.');
end

%% Sinusoidal Wavefolder Functions

% (1) Standard Sinusoidal Wavefolder
function y = standard_sinusoidal_wavefolder(x, foldAmount)
    y = sin(foldAmount * asin(x));
end

% (2) Phase-Inverted Sinusoidal Wavefolder
function y = inverted_sinusoidal_wavefolder(x, foldAmount)
    y = -sin((pi/2) * asin(x)); % The phase-inverted version
end

%% Single Processing Loop
Vout1 = zeros(size(Vin)); % Standard Sinusoidal Wavefolder
Vout2 = zeros(size(Vin)); % Phase-Inverted Sinusoidal Wavefolder

foldAmount = 2;  % Controls how much the wave folds (adjustable)

for n = 1:length(Vin)
    Vout1(n) = standard_sinusoidal_wavefolder(Vin(n), foldAmount);
    Vout2(n) = inverted_sinusoidal_wavefolder(Vin(n), foldAmount);
end

%% Plotting
if strcmp(inputType, 'sine')
    figure;
    subplot(2,1,1);
    plot(T, Vin, 'b-', 'LineWidth', 1);
    hold on;
    plot(T, Vout1, 'r-', 'LineWidth', 1);
    legend('Vin', 'Standard Wavefolder Vout');
    title('Standard Sinusoidal Wavefolder Output');
    xlabel('Time (s)');
    ylabel('Amplitude');
    grid on;

    subplot(2,1,2);
    plot(T, Vin, 'b-', 'LineWidth', 1);
    hold on;
    plot(T, Vout2, 'g-', 'LineWidth', 1);
    legend('Vin', 'Inverted Wavefolder Vout');
    title('Inverted Sinusoidal Wavefolder Output (-sin(π/2 x))');
    xlabel('Time (s)');
    ylabel('Amplitude');
    grid on;

elseif strcmp(inputType, 'dc_sweep')
    figure;
    subplot(2,1,1);
    plot(T, Vout1, 'r-', 'LineWidth', 1);
    title('DC Sweep: Standard Sinusoidal Wavefolder');
    xlabel('Vin (V)');
    ylabel('Vout (V)');
    grid on;
    xlim([-1, 1]);
    ylim([-1, 1]);

    subplot(2,1,2);
    plot(T, Vout2, 'g-', 'LineWidth', 1);
    title('DC Sweep: Inverted Sinusoidal Wavefolder');
    xlabel('Vin (V)');
    ylabel('Vout (V)');
    grid on;
    xlim([-1, 1]);
    ylim([-1, 1]);

else % impulse
    figure;
    subplot(2,1,1);
    stem(T, Vout1, 'filled');
    title('Impulse Response - Standard Wavefolder');
    xlabel('Time (s)');
    ylabel('Amplitude');
    grid on;

    subplot(2,1,2);
    stem(T, Vout2, 'filled');
    title('Impulse Response - Inverted Wavefolder');
    xlabel('Time (s)');
    ylabel('Amplitude');
    grid on;

    % Frequency response
    [H1, W1] = freqz(Vout1, 1, 2048, Fs);
    [H2, W2] = freqz(Vout2, 1, 2048, Fs);

    figure;
    subplot(2,1,1);
    semilogx(W1, 20*log10(abs(H1)), 'LineWidth', 1);
    title('Frequency Response: Standard Sinusoidal Wavefolder');
    xlabel('Frequency (Hz)');
    ylabel('Magnitude (dB)');
    grid on;

    subplot(2,1,2);
    semilogx(W2, 20*log10(abs(H2)), 'LineWidth', 1);
    title('Frequency Response: Inverted Sinusoidal Wavefolder');
    xlabel('Frequency (Hz)');
    ylabel('Magnitude (dB)');
    grid on;
end
EDIT: script link fixed
Dan Korneff - Producer / Mixer / Audio Nerd
-
Nice yeah, so a little more complex than just sin() that makes sense.
But essentially the same concept. Waveshaper.