Seeking Help: Bipolar Modulation, UI from Scriptnode
-
Hello, I'm using the scriptnode template:
template.bipolar_modto modulate the signal of
template.dry_wet. I believe everything is working as I expect, but I can't figure out how to dynamically visualize the increase or decrease of the signal. I'm seeking help to visualize the PMA as it appears in scriptnode; I'm attaching a screenshot to explain it better.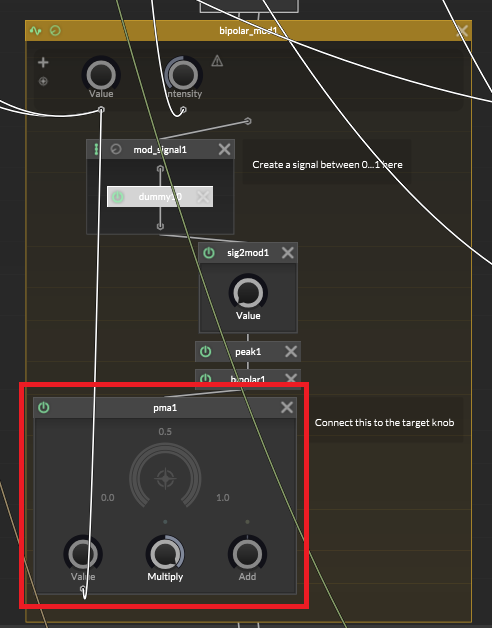
-
M Mighty23 marked this topic as a question on
-
@Mighty23 said in Seeking Help: Bipolar Modulation, UI from Scriptnode:
Hello, I'm using the scriptnode template:
template.bipolar_modto modulate the signal of
template.dry_wet. I believe everything is working as I expect, but I can't figure out how to dynamically visualize the increase or decrease of the signal. I'm seeking help to visualize the PMA as it appears in scriptnode; I'm attaching a screenshot to explain it better.Perhaps I need to refresh the UI with a Timer. Does anyone have a simplified example I can look at?
I'm looking for a way to allow the user to understand how and when modulation is affecting the signal -
Clear the mod signal, connect the PMA output to an add node afterwards, then use a peak node to display the actual PMA value that is being sent out:
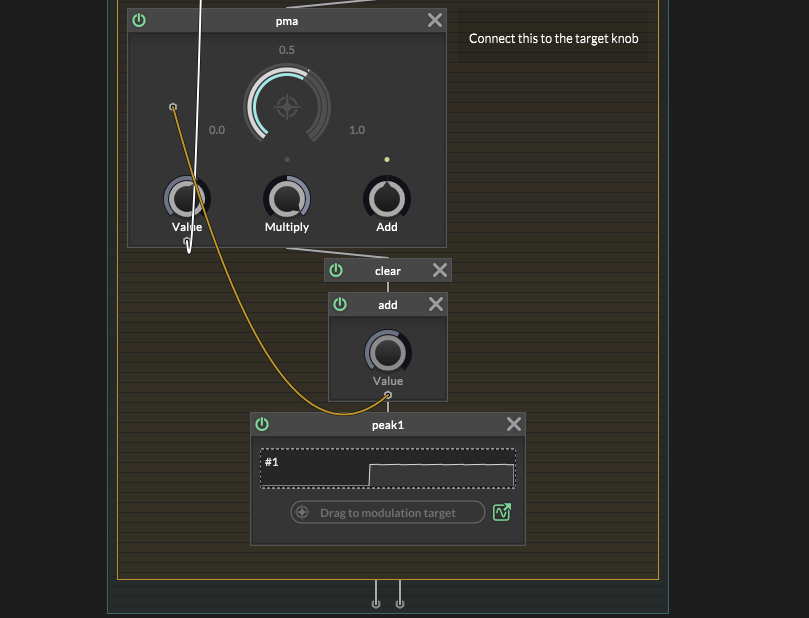
From then on, use the external display buffer to visualize it however you like (or you can send it into a global_cable node instead of the peak signal if you don't need a continuous visualization).