Forum
    • Categories
    • Register
    • Login

    applyMask greedy as hell!

    Scheduled Pinned Locked Moved General Questions
    1 Posts 1 Posters 11 Views
    Loading More Posts
    • Oldest to Newest
    • Newest to Oldest
    • Most Votes
    Reply
    • Reply as topic
    Log in to reply
    This topic has been deleted. Only users with topic management privileges can see it.
    • ustkU
      ustk
      last edited by ustk

      I have an UI that is not so much busy but still has quite advanced drawings (no images, all vectors)

      It's laggy as hell, so I naturally decided to track this down with the profiler.
      Following the result, it feels like it's a general overload and nothing in particular is taking a big amount of the CPU.

      Still, I tried to comment out some known greedy methods, and then I discovered this tiny thing

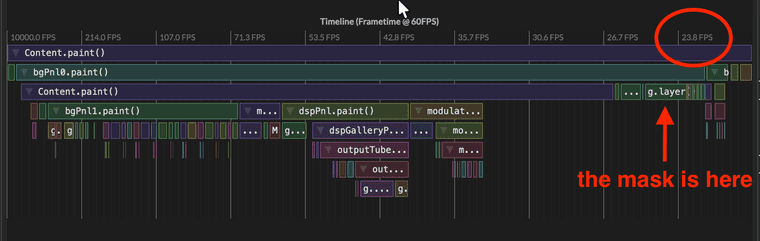
      	g.beginLayer(true);
      	g.applyMask(gridPath, this.getLocalBounds(0.0), true);
      	g.endLayer();
      

      was causing all the fuss despite being almost insignificant in the profiler!

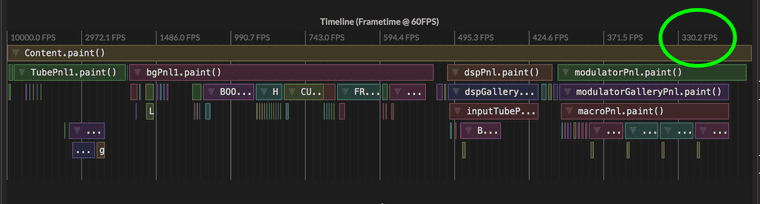
      see the result with the mask, then without, almost x14 improvement!

      WITH MASK
      Screenshot 2026-02-04 at 18.52.01.png

      WITHOUT MASK
      Screenshot 2026-02-04 at 18.52.27.png

      So either the profiler is not able to effectively catch the bottleneck or I don't understand how to read it (which might be the case in the end...)

      Hise made me an F5 dude, any other app just suffers...

      1 Reply Last reply Reply Quote 0
      • First post
        Last post

      36

      Online

      2.2k

      Users

      13.3k

      Topics

      116.2k

      Posts