Experiencing crashes with intensive paint routine. What can I do to fix this?
-
Hello,
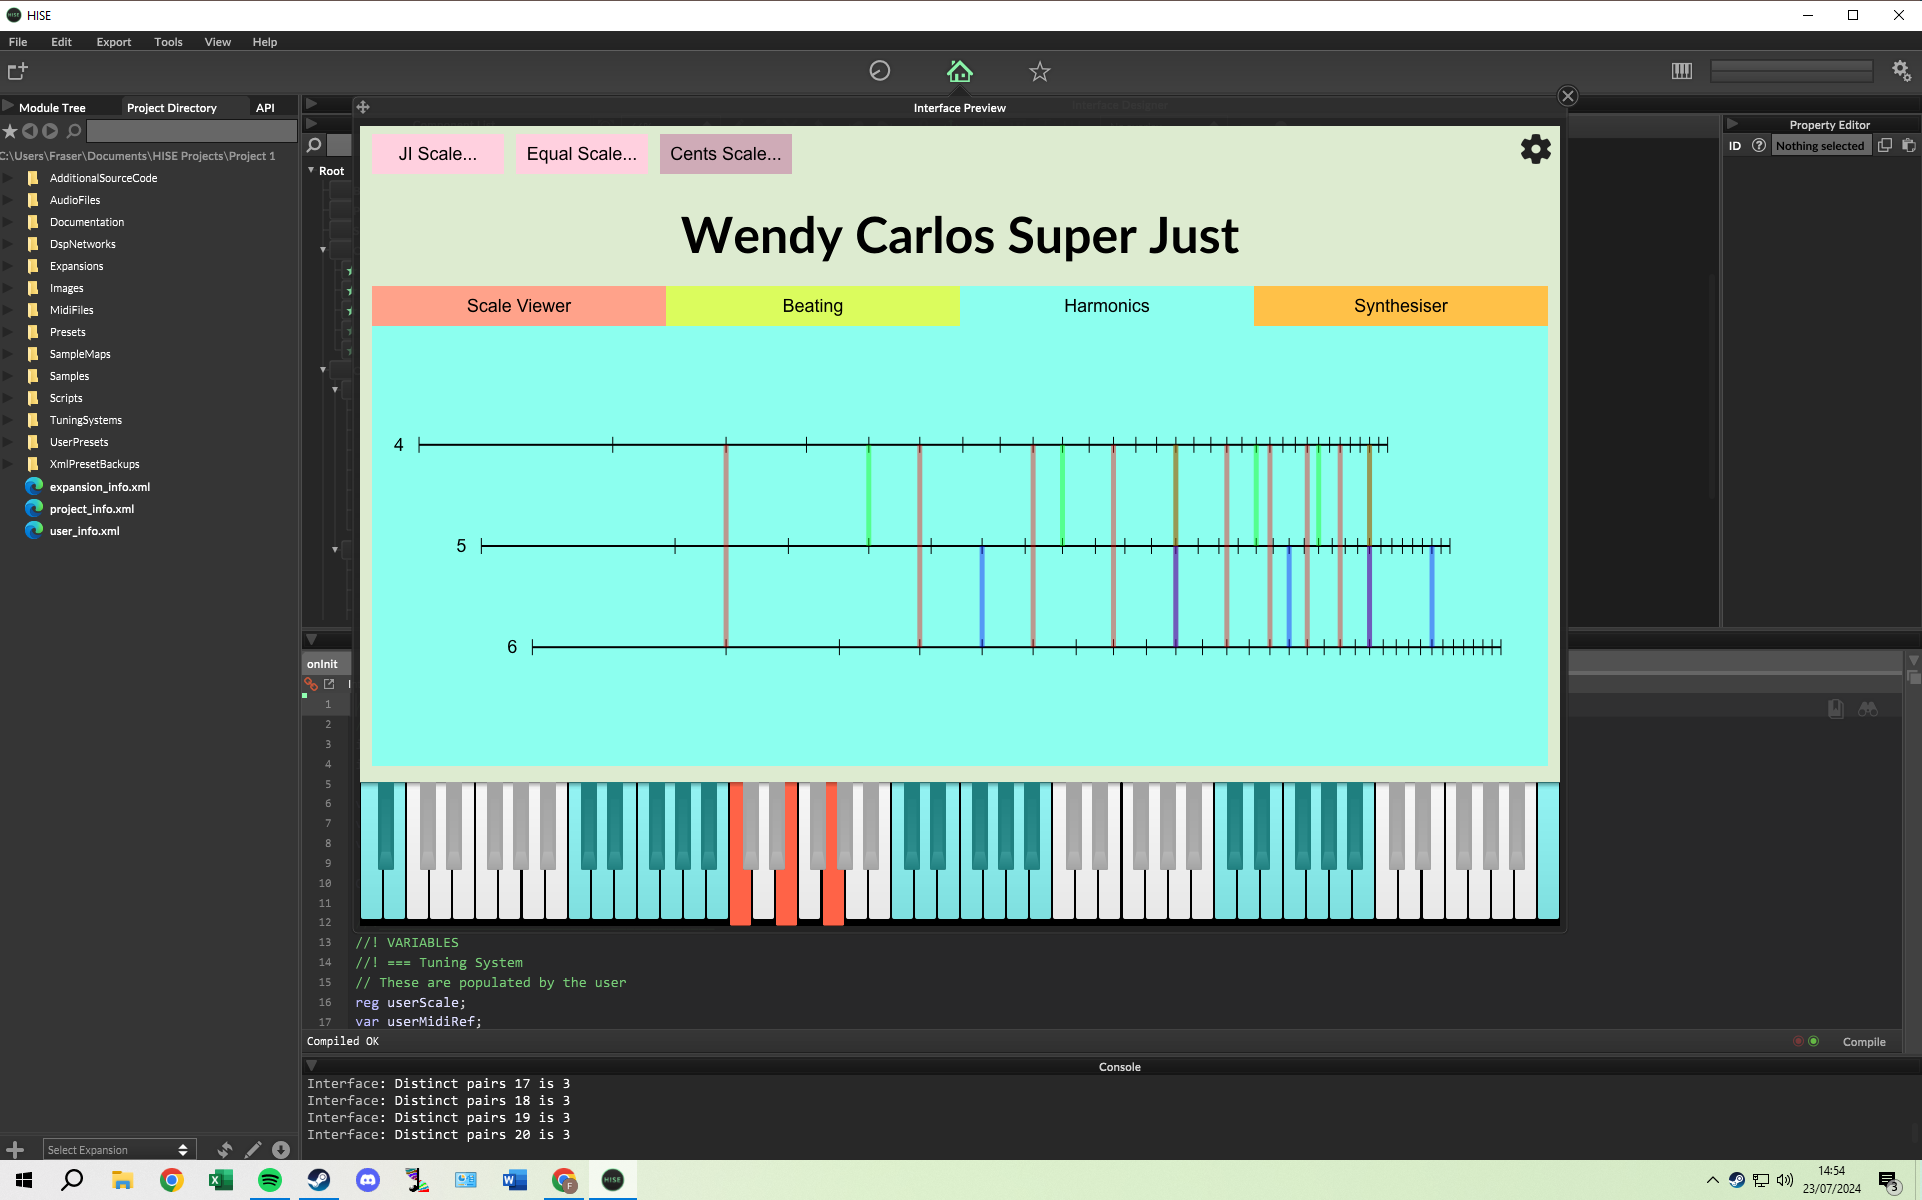
I'm currently writing code to visualise information about the harmonics of held notes in real time:

For each held note, a paint routine draws to a panel: a horizontal line; small vertical lines across this line to represent each harmonic; coloured vertical lines between any matching harmonics; and a number in front of the line showing its ratio relationship to the other notes. And of course there's a bunch of calculations outside of the paint routine to work out the coordinates for all of these elements.
The process is nearly in real time, with ~1 second of lag, but gets worse the more notes are held down, and if you mash multiple notes quickly, the instance of HISE will just crash.
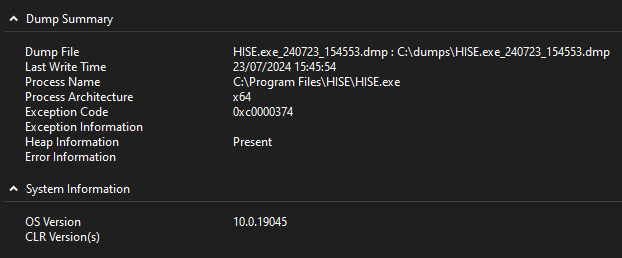
The crash is easy to replicate every time, and having followed the crash reporting advice on the forums I've managed to install Procdump. It gives me code 0xc0000374 most times, though it also produced 0xc0000409 once.

I know my code is pretty intensive; it has to search for matching harmonics between each unique pair of held notes, so calculations rise exponentially with each additional note (for 2 notes, there is 1 pair of notes / for 3 there are 3 pairs / for 4 there are 6 pairs and so on). With ten held notes and modelling 16 harmonics, it has to search through 55 pairs of notes, and for each pair has to check 16 harmonics against 16 other harmonics!
So my questions:
-
How can I monitor how much memory I'm using so I can understand how hard I am pushing HISE? Is there even a way to see which lines of code are most intensive? I don't see any obvious leaps in RAM usage on Task Manager but I don't really know what I'm looking for.
-
Is there a specific memory usage limit before HISE will crash? Is it based on my hardware or is there some internal limit? If I know this I can probably make some kind of failsafe to stop HISE trying to make calculations if it detects too much user input.
-
Am I going about this the wrong way? It seems like I'm pushing paint routines way beyond their intended use.
If there's no good way to make this feature work, I can always have the user select their notes and then press a button to generate the graph, but I really like the utility of seeing the harmonic relationships in real time.
Thanks!
-
-
@cynthasiser Have you deferred the script? You can use
Console.startBenchmark()andConsole.stopBenchmark()to get an idea of how long your calls take to process.@cynthasiser said in Experiencing crashes with intensive paint routine. What can I do to fix this?:
How can I monitor how much memory I'm using so I can understand how hard I am pushing HISE?
Click the little keyboard in the top right of HISE. The modal pop out that appears shows the current CPU and RAM usage.
@cynthasiser said in Experiencing crashes with intensive paint routine. What can I do to fix this?:
Is there a specific memory usage limit before HISE will crash?
No, and I doubt a paint routine is eating up much RAM.
@cynthasiser said in Experiencing crashes with intensive paint routine. What can I do to fix this?:
Am I going about this the wrong way? It seems like I'm pushing paint routines way beyond their intended use.
No idea without seeing your code.
-
@d-healey
Thanks for this, didn't know about benchmarking or the CPU/RAM usage monitor, very useful!
The RAM usage is absolutely fine, it was the CPU usage that's bad, pushing ten notes simultaneously makes it leap to 4-500%. Without this harmonic display function running, 10 simultaneous notes only puts the CPU up to ~100%, still not good, but clearly most of the problem is happening in my new code.
I think the main problem comes from the fact that my code runs on each note press and release, so if I press 5 keys it runs the code for key 1, then 1 + 2, then 1,2,3 then 1,2,3,4 and then 1,2,3,4,5 in quick succession, and then the same in reverse as they are released.
Pressing and releasing 10 notes, the benchmark shows:
Interface: Benchmark Result: 0.002 ms
Interface: Benchmark Result: 0.425 ms
Interface: Benchmark Result: 1.296 ms
Interface: Benchmark Result: 2.569 ms
Interface: Benchmark Result: 4.257 ms
Interface: Benchmark Result: 6.428 ms
Interface: Benchmark Result: 8.926 ms
Interface: Benchmark Result: 11.879 ms
Interface: Benchmark Result: 15.359 ms
Interface: Benchmark Result: 19.080 ms // 10 notes, the calculation I actually want!
Interface: Benchmark Result: 15.206 ms
Interface: Benchmark Result: 11.813 ms
Interface: Benchmark Result: 8.866 ms
Interface: Benchmark Result: 6.288 ms
Interface: Benchmark Result: 4.227 ms
Interface: Benchmark Result: 2.464 ms
Interface: Benchmark Result: 1.267 ms
Interface: Benchmark Result: 0.423 ms
Interface: Benchmark Result: 0.001 ms
Interface: Benchmark Result: 0.000 msSo while the calculation is intensive, the bigger problem is I'm doing loads of unnecessary ones either side of it.
Is there a way to make the code wait for say 0.5 seconds of no inputs before it will run?
And also is there a live graph somewhere to show CPU usage over time, or is it just the number on the little keyboard?
-
@cynthasiser said in Experiencing crashes with intensive paint routine. What can I do to fix this?:
Is there a way to make the code wait for say 0.5 seconds of no inputs before it will run?
Use a timer
@cynthasiser said in Experiencing crashes with intensive paint routine. What can I do to fix this?:
And also is there a live graph somewhere to show CPU usage over time, or is it just the number on the little keyboard?
You can use
Engine.getCpuUsage()Is your script deferred?
-
@d-healey What does deferred mean?
-
-
@d-healey Okay, my entire plugin now runs almost perfectly in real time with 0% ram and cpu usage
 thank you very much! Reading through that, my plugin is the exact use case for deferred callbacks!
 -
C cynthasiser has marked this topic as solved on
-
@cynthasiser Glad we solved it :)